Rank your customers by profit, not revenue
Rank your customers by revenue and you get a list you already know. Rank them by profit and it changes. How to build both lists in an afternoon with your books and some honest estimates, what each kind of surprise means, and why you reprice the bottom of the list before you drop anyone.
 ChatGPT Images 2.0
Same prompt, 2 AI models — swipe to compare. Showing 1 of 2.
Made with ChatGPT Images 2.0 (GPT Image (web))view prompthide prompt
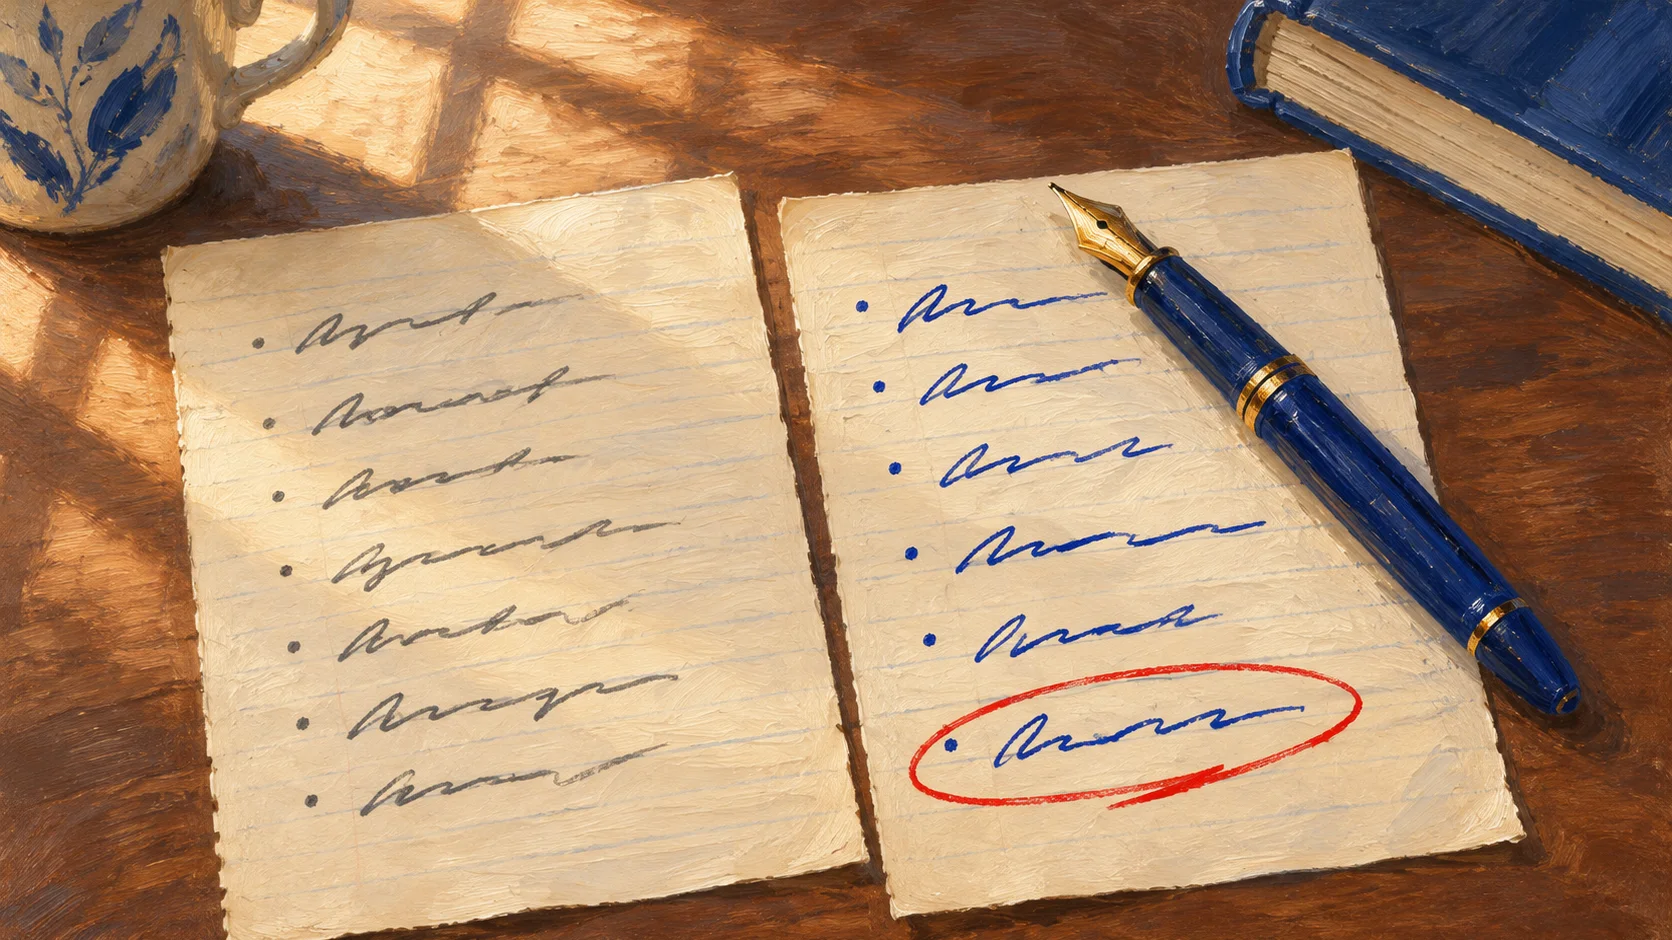
Create an editorial magazine illustration in a hand-painted style with visible soft brushstrokes and subtle oil-painting texture. NOT photoreal, NOT a 3D render. Palette: cool slate-navy and warm cream with selective deep cobalt blue accents with a single bold red accent used as a deliberate callout, cinematic 16:9 widescreen. Composition: two sheets of cream lined notepaper lying side by side on a warm walnut desk in soft morning window light from the upper left, each sheet holding a short handwritten list of impressionistic, intentionally illegible ink entries, the left sheet written in plain dark graphite, the right sheet written in deep cobalt-blue ink, one entry near the bottom of the right sheet encircled by a single loose hand-drawn loop of bold red ink, a cobalt-blue fountain pen resting diagonally across the right sheet, quiet still life, no people, no readable words, no numbers, no logos. No people, no readable text, no logos.
HERO for article-28 (LCP), owner web-lane pass. Native 1672x941, trimmed 1px of height to 1672x940 (16:9). Edge strips checked at full size: no signature or watermark. Wins the LCP slot because it is the concept as written: the gut list in graphite, the profit list in cobalt, and one entry on the profit list circled in red, which is the article's whole argument (the two lists disagree about one customer). It added a cobalt mug and book at the edges the prompt did not ask for; harmless. Local lanes were tried the same day and rejected: SDXL drew abstract ink streaks with no lists, Flux drew near-readable fake text, a blank left sheet and a fake '© ...' signature.
Rank your customers by revenue and you get a list you already know by heart. You could recite the top five in the shower.
Rank them by profit, meaning what's actually left after everything each one costs you, and the list rearranges itself. Somewhere near the bottom is a name you'd have sworn was one of your best.
The most famous time anyone did this properly was at a Swedish heating-wire maker called Kanthal, in the late 1980s, and what came out of it looked like a typo.
At Kanthal, 20% of customers produced 225% of the profitWhen Robin Cooper and Robert Kaplan, two of the Harvard Business School professors behind activity-based costing, wrote it up for Harvard Business Review, the most profitable 20% of customers generated 225% of the company's profit. The middle 70% hovered around break-even. The bottom 10% lost 125% of it.
Do the math on that. 225 minus 125 is 100. The best fifth of the customer list made more than all the money the business made, and the worst tenth quietly handed more than half of it back.
- 1The most profitable 20% of customers: 225% of the profit.
- 2The middle 70%: around break-even, so the line barely moves.
- 3The bottom 10% lost 125% of the profit, pulling the total back down to the 100% the company actually made.
| Share of customers, most profitable first | Running total of profit, % of the company's profit |
|---|---|
| 0% | 0% |
| 20% | 225% |
| 90% | 225% |
| 100% | 100% |
And the customers losing the most money were among the biggest ones. The professors' explanation is almost insultingly simple: "You can't lose large amounts of money on a small customer." Kanthal's big losers had demanded lower prices, wanted frequent deliveries of small batches, leaned hard on the sales and technical people, and kept asking for product changes. All of it was cost, and none of it showed up next to their name.
Kaplan later wrote that some version of this, with 15 to 20% of customers generating 100% or more of the profit, turns up in virtually every customer profitability study ever done. The studies I could find were all of big companies, and I couldn't find anyone who'd measured it properly for a business with five or fifteen people, so your numbers may look nothing like Kanthal's.
What made Kanthal's big customers expensive doesn't depend on size, though. A customer who gets a standing discount, sends small rush jobs and takes an hour on the phone for every hour of real work costs you the same way Kanthal's big accounts did, and in a small business all of it lands on you. The only way to know what your own list looks like is to build it and hold it up against the one in your head. We call that the Swap Test, and it takes two lists, your books, a spreadsheet and an afternoon.
First, write down the list you already have
Before you open a single report, take a sheet of paper and write down your five best customers and your five worst, from memory. Don't look anything up. This is your gut list, and the comparison at the end only works if it's on paper before the numbers have a chance to change your mind.
You've probably been keeping this list for years. A contractor on Fine Homebuilding's forum described what a lot of owners already do with it: when you rebid a difficult client, "add in 10% for the 'person' factor." That instinct is usually right.
What the gut list can't see is the customer who's pleasant and expensive at the same time. They're friendly. They pay, eventually. They always have "just a quick one," they've had the same discount since 2022 because you gave it to them when they were new, and you don't count the forty minutes on the phone because honestly, you like talking to them. A window cleaner in a thread about commercial accounts described the problem better than I can: "There is so much more time that goes into managing that account… that is unrelated to washing a window."
Then build the profit list
One warning before you start: your books only hold half of this. Your accounting software knows exactly what you billed each customer. It mostly doesn't know what each one cost you, because nobody tags payroll to a customer, and your own hours aren't in there at all.
(If you've ever run QuickBooks' Profit and Loss by Customer report and felt pleasantly surprised, that's why. It only counts costs somebody assigned to a customer, so everybody looks great.)
So the profit list is your books plus some honest estimates. Rough is fine. You're looking for the bottom of the list, and finding it doesn't take precision.
1. Pull revenue by customer for the last twelve months. In QuickBooks Online that's the Sales by Customer Summary report, and most accounting tools have an equivalent. Take the top fifteen or so, plus any smaller customer you've got a funny feeling about. Use what you billed them, after discounts and credits.
2. Subtract what you bought specifically for them. Materials, parts, subcontractors, anything that only exists because of their jobs.
3. Estimate every hour they took, then put a price on it. Every hour means every hour: quoting, site visits, calls, emails, revisions, driving, and chasing the invoice. Include yours. For staff, an hour's cost is their pay plus payroll taxes and benefits, divided by the hours you pay them for. For yourself, use what you'd have to pay someone to do your job.
To keep it simple, you can use one blended rate for everybody. The example below uses $45 an hour. That's one employee who costs $35 an hour once taxes and benefits are in, and an owner whose time is worth $55, each doing about half the hours. Half at $35 and half at $55 averages out to $45.
4. Write down the extras. How many jobs were rush jobs? How late do they pay on average? Is there a standing discount? These won't all go into the arithmetic, but you'll want them in front of you when you compare the lists.
5. Sort by what's left, then divide it by hours. The first sort shows who leaves you the most money in total. The second, what's left per hour of your time, is the one that catches the small, busy customer who never looks like a problem because their invoices are small.
Three made-up customers at that $45 blended rate:
Customer | Billed (12 mo) | Materials & subs | Hours (all of them) | Hours × $45 | What's left | Per hour |
|---|---|---|---|---|---|---|
A: the big account | $48,000 | $14,000 | 410 | $18,450 | $15,550 | $38 |
B: the small one | $9,000 | $2,500 | 60 | $2,700 | $3,800 | $63 |
C: the nice one | $22,000 | $6,000 | 330 | $14,850 | $1,150 | $3 |
A is still your most valuable customer in total, but once each hour is paid for, an hour on A leaves you $38 and an hour on B leaves you $63. B is tiny, and B is the best hour you sell. C is the customer everybody in the office likes, and an hour spent on C leaves you about the price of a coffee.
Put the two lists side by side
Now get the sheet of paper back out. Some names will be right where you expected. The useful ones are the names that moved, and above all the ones that swapped sides. Most are one of four surprises.
A customer you like is near the bottom. This is C, and it's the main reason to do the exercise at all. Reprice to the real workload: if C takes 330 hours, quote like it. Then charge for the expensive habits with a rush fee, a minimum job size, or a set number of revisions or calls included and a rate after that. It's the contractor's 10% again, except now it's on the quote and the customer can see what it's for.
A small customer is near the top per hour. This is B, and B is a template. Work out what makes B's jobs efficient (the kind of work, how they hand it over, how quickly they decide) and go looking for more customers like that. Asking B who else they know is a decent start.
A big account earns less per hour than you thought. This is A. A is still your biggest earner, so treat it as a tune-up. Look at where the hours go. If it's rush jobs and constant small changes, a minimum order or a rush fee fixes it. If A pays slowly, a deposit or payment on completion instead of net-60 fixes the cash-flow side, which no price increase touches.
One of your five worst is near the top. Then the person factor is doing its job. You're being paid for the aggravation, and you get to decide whether that's still a trade you want.
Then let each customer decide. Some will pay the new price — a few probably knew they were getting a deal. Some will leave, and at that point it's their call and your hours are free for another B.
Before you fire anyone
The tempting move with C is to drop them. Hold off, for two reasons.
First, "what's left" in that table is before your rent, insurance, software and the van payment, and on purpose. Those costs don't leave when a customer does. As long as a customer covers their own materials and hours with something to spare, they're chipping in toward the bills you'd be paying anyway, and dropping them makes your month worse. The exception is when the hours are genuinely scarce: if your crew or your calendar is fully booked and C's hours could go to a B, the math changes fast.
Second, the professors who made this analysis famous were blunt about it. Cooper and Kaplan wrote that managers "should not use the information naively to close plants, drop customers, or eliminate products." Kanthal changed how it did business with its big money-losers, through price changes and minimum order sizes, and turned them into what the article calls "strong profit contributors."
Every low number on the profit list should be one you chose.
Because some low numbers are fine. A window cleaner defending commercial work in another thread said it well: "Commercial pays less in the immediate, but it's consistency makes it worth it." A steady contract that keeps your people busy through February can be worth a thin margin, and plenty of good businesses take that trade deliberately. What you want to get rid of are the low numbers you never agreed to: the discount nobody revisited, the free hours that became a habit, the invoice that's always forty days late.
Making it a monthly report instead of a yearly afternoon

Made with ChatGPT Images 2.0 (GPT Image (web))view prompthide prompt
Create an editorial magazine illustration in a hand-painted style with visible soft brushstrokes and subtle oil-painting texture. NOT photoreal, NOT a 3D render. Palette: cool slate-navy and warm cream with selective deep cobalt blue accents, cinematic 16:9 widescreen. Composition: an open cloth-bound account book lying flat on a warm walnut desk, its cream pages ruled into neat columns of impressionistic, illegible handwritten figures, a deep cobalt-blue silk ribbon bookmark laid across the open page, a small unmarked tear-off desk calendar standing beside the book, a sense of order and routine, soft raking morning light from the left, cream and slate-navy tones with deep cobalt accents, no people, no readable words, no numbers, no logos. No people, no readable text, no logos.
MID for article-28, placed under 'Making it a monthly report': the ledger and the calendar are the routine the section argues for. Same lane and pass as the hero, so the pair reads as one commission. Native 1672x941, trimmed to 1672x940. Edge strips clean. Its own columns hold almost-number marks, but nothing reads as a figure. Alternatives the same day: Gemini drew clearly readable figures (the prompt said no numbers), SDXL a coherent but plainer open book, Flux a garbled calendar. Mids are single images, so none of them ship.
Most of that afternoon went on rebuilding things your business already knew and never kept in one place. Revenue lives in the accounting software. Hours live in a time tracker, a job app or your memory. Discounts are buried in old invoices, and rush jobs are in your inbox. It's the problem of disconnected tools that each hold one piece of the answer, and it's why getting one honest number is harder than it should be.
You can fix that yourself. Turn on expense tracking by customer in your accounting software, have everyone log time against a customer (yourself especially), and in about three months most of the list you built by hand is sitting in your books. Keep reading it every month, because the monthly pass over the numbers is where you catch one that's gone wrong. If you'd rather not do the setup, that's the part we take off your plate at NuWay.
We run the first ranking with you. You bring the customer list and what you know about them, and we do the pulling and the arithmetic, so most of the afternoon becomes our job instead of yours.
We connect the pieces. Your accounting software, your time tracking or job app and your invoicing get wired together, so each hour and each expense lands against a customer as it happens. Some tools won't connect. For those we set up the simplest habit that does the job, like a customer field on every time entry.
You get the profit list every month. It's built from the connected data, with the customers who moved since last month at the top, so nobody has to rebuild it by hand.
If you'd like to run the Swap Test every month instead of once a year, start a no-pressure conversation about setting it up for your business.
Cheers, from the boring side of the business,

P.S. That chart of Kanthal's customers has a name. Accountants call it the whale curve, because the line climbs, runs along the top and dives back down, a bit like a whale surfacing. Most owners use "whale" for something else: their biggest customer. Which gets a little awkward if your biggest whale turns out to be what sends the curve back down.
Want help applying this to your business? Start a no-pressure conversation →
Frequently asked questions
- How do I figure out which of my customers are actually profitable?
- Start with revenue by customer for the last twelve months, which most accounting software gives you directly (in QuickBooks Online it's the Sales by Customer Summary report). Take the top fifteen or so. For each one, subtract what you bought specifically for them, then estimate every hour they took, including quoting, calls, revisions, driving and chasing payment, and multiply by what an hour of that work really costs you. Sort by what's left, and also by what's left per hour. The first pass is rough, and rough is enough to see who's at the bottom.
- Why doesn't the Profit and Loss by Customer report in QuickBooks show this already?
- Because it only counts costs that someone tagged to a customer, and most small businesses don't tag payroll or general expenses that way. Everything untagged sits outside any customer's column, so every customer looks more profitable than they are. The owner's own time is missing entirely unless you put a cost on it yourself. Turning on expense tracking by customer and logging time against customers fixes most of this going forward.
- What should I do when a customer I like turns out to be unprofitable?
- Reprice to the work they actually take, and charge for the habits that cost you most: rush jobs, constant small changes, long calls. A rush fee, a minimum job size or a set number of revisions included all do this. If they pay slowly, ask for a deposit or payment on completion. Then let them decide. Some will stay at the new price, and if one leaves, those hours are free for a customer who pays for them.
- Should I fire my unprofitable customers?
- Usually not first. Rent, insurance and software don't go away when a customer leaves, so a customer whose work covers its own direct costs with something to spare is still helping pay those. The researchers who made this analysis famous warned explicitly against using it to drop customers naively. The company in their study changed prices, set minimum order sizes and changed how it served its big money-losing customers, and turned them into strong profit contributors. Reprice, add a minimum or a rush fee, change the payment terms, then decide.
- Is it ever fine to keep a low-margin customer?
- Yes, when you chose it. A steady commercial contract that keeps a crew busy through the slow season can be worth a thin margin, and plenty of owners take that trade on purpose. The point of ranking customers is to make sure every low number on the list is one you picked, rather than one that crept up on you through discounts, rush jobs and unpaid hours.

Know someone who needs this?